Every great budget hinges on the revenue forecast. How many new accounts will we sell? How large will these accounts be and how fast will we close these deals? It is every analyst’s challenge to answer these questions using the data they have available to them. In this article I will present one path to budgeting the new sales bookings portion of the revenue forecast using data from Salesforce, but really it could be any pipeline management tool.
In this example, I’ve used the native Tableau connector to Salesforce to pull pipeline data into a dashboard, but you could also set this up in Excel using a few pivot tables. To help with building your data source, Salesforce provides expansive online help to understand how tables are joined. The benefit of using Tableau here is that the data can be set to automatically refresh on a regular basis so that you can always be sure you are using current data, and the visualization can be specifically customized to meet your needs.
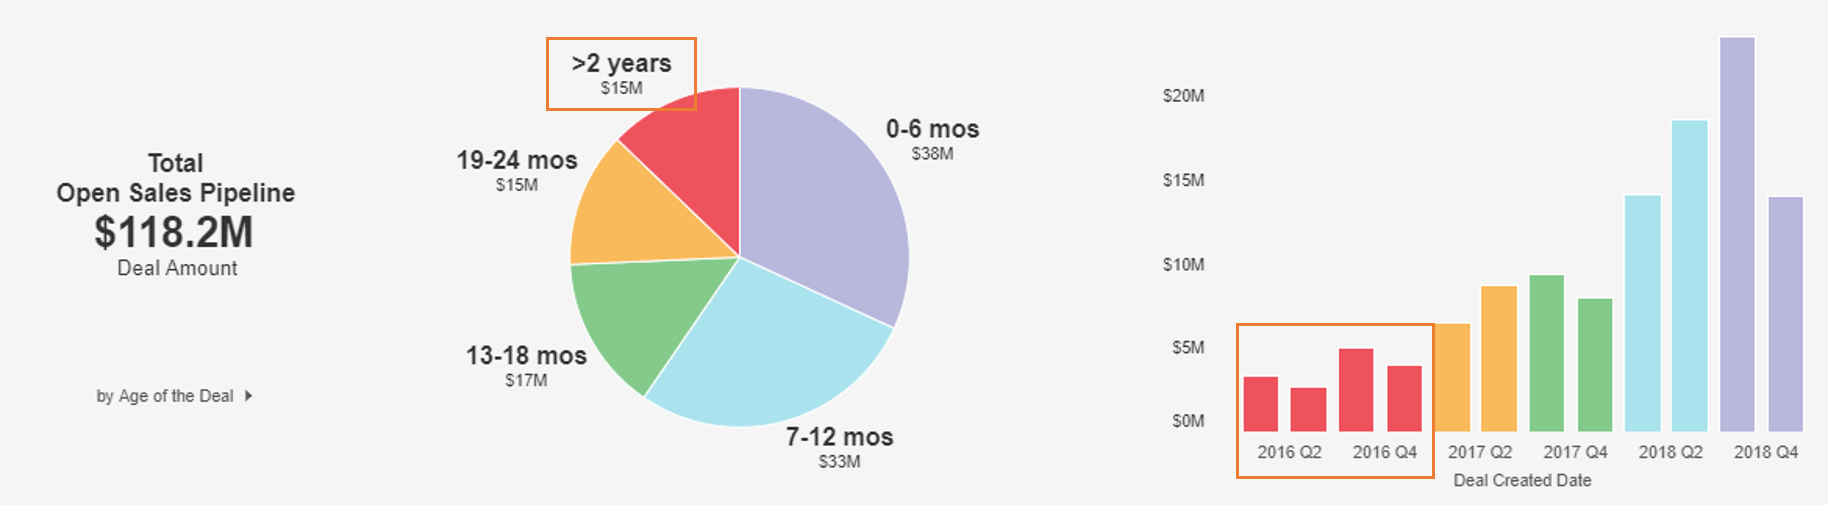
There key here is that you want to create visibility to (1) currently Open pipeline by the Date the deal was created; and (2) Open vs. Closed pipeline comparing Date Created vs Date Closed. You can group your dates by month or quarter, depending on how precise you which to be. Here I’ve grouped our dates by quarter but Tableau also provides the ability to drill-down to a monthly view by hovering over the quarter axis and clicking +. Once you’ve got your output built, you can see the age of currently open Pipeline as well as the close rate over time for each quarterly cohort.
Next we must assess the quality of our current pipeline.
There are a few ways to do this, including having a long sit-down with the sales team to review each pipeline opportunity. Though this long and arduous process produces an outcome that is quasi-accurate for about a day, it’s still worth doing to some degree because it produces one data point which can be used to compare against the next process.
The next process is much faster and leverages your existing data to give you a high level estimate of pipeline data quality.
Using your sales pipeline visualization, you can gain an understanding of the age of your pipeline and how long it generally has taken your sales team to close a deal in the past. To use this approach, you must believe that historical performance has some relation to future sales team performance.
In this example case, about 13% of our pipeline is more than 2 years old, which leads us to question whether that portion of our pipeline is still viable. We may choose to exclude it from our forecast. By excluding it, any future bookings from that cohort could be considered upside to the budget.
Old pipeline is unlikely to produce many more Closed Won deals
We also see that a little more than a quarter of deals that get entered to the pipeline actually move to Closed Won, and that it takes about 4 quarters after the Deal is entered to the pipeline to reach the 25-30% close rate mark. Closed Won deals hover close 0-1% of pipeline each quarter from that point forward.
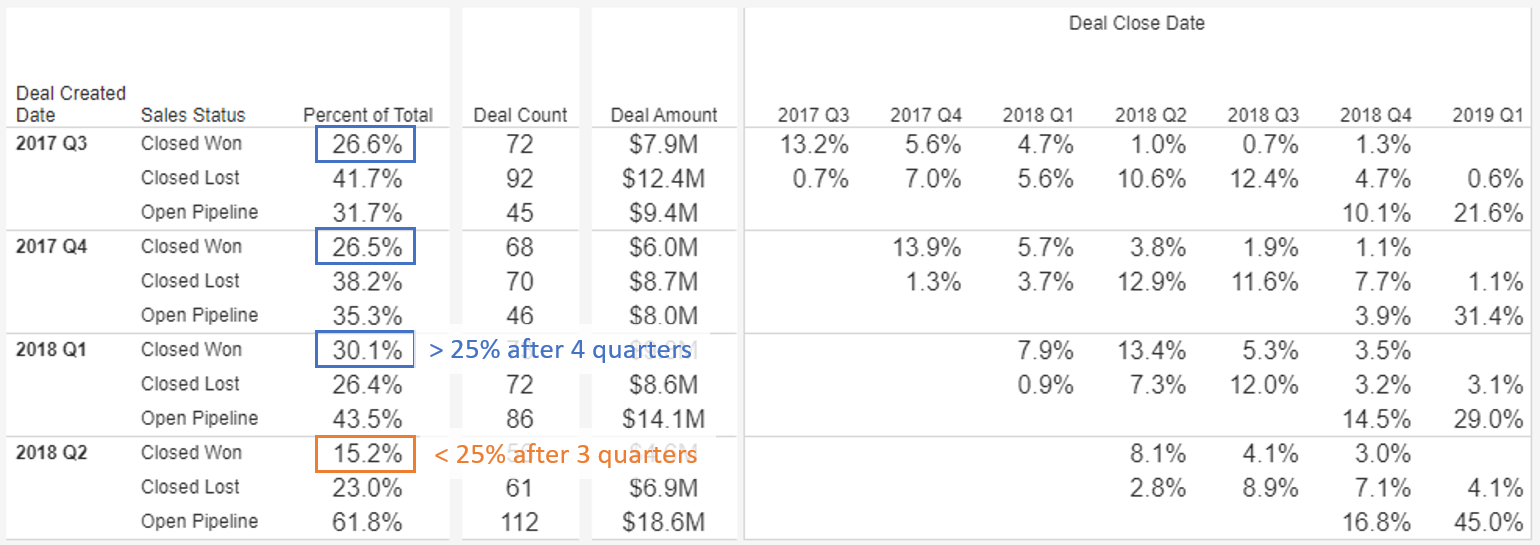
The average close rate of 25-30% is reached after 4 quarters
We can also see that the close rate doesn’t go much higher after that fourth quarter of aging. This provides further reason to question whether to include old pipeline in the forecast. We may even choose to exclude pipeline that is 1 or more years aged based on this analysis.
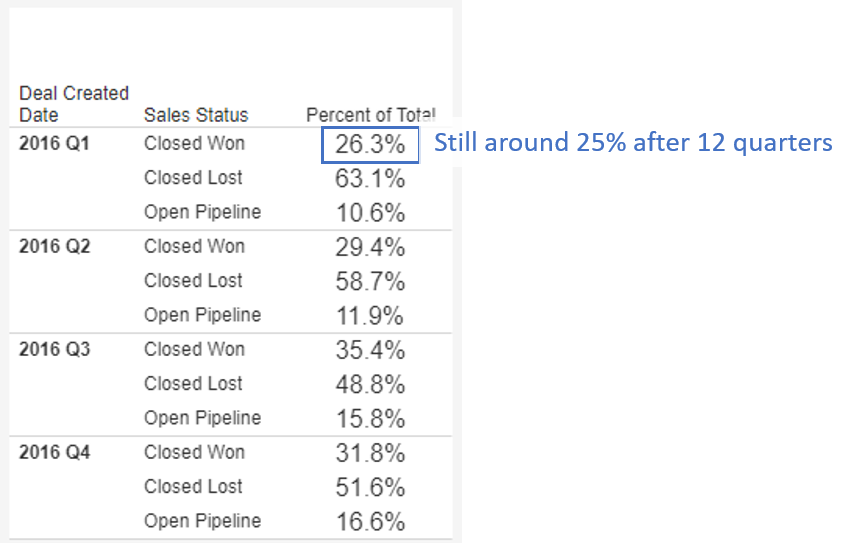
Old pipeline doesn’t result in many more Closed Won deals than we had after 4 quarters
We’ve learned a lot here. How do we translate this to a new sales bookings forecast?
First I’m going to choose to exclude all pipeline which is 1+ years old from the Date it was Created. In Tableau, I can do this by clicking and dragging to select the three pie slices for these time periods and then selecting Exclude.
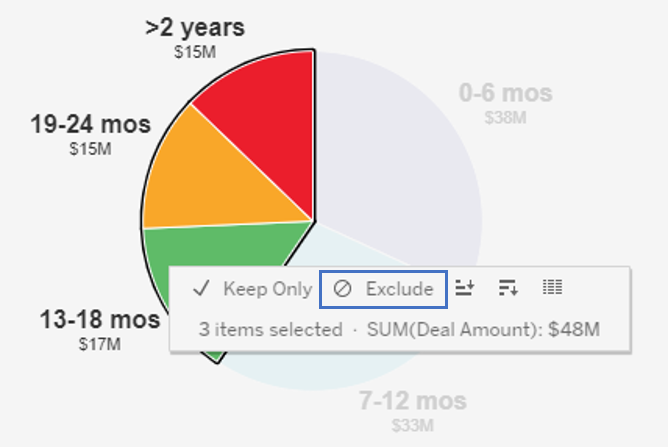
Exclude old pipeline to filter down to viable pipeline
This leaves us with $70.4M of open pipeline that we actually expect to have an opportunity to close. Based on historical close rates, I am going to assume that 28% of total pipeline is expected to be Closed Won within 4 quarters of the Date the pipeline deal was Created. That leaves 13% of 2Q’18, 17% of 3Q’18, and 16% of 4Q’18.
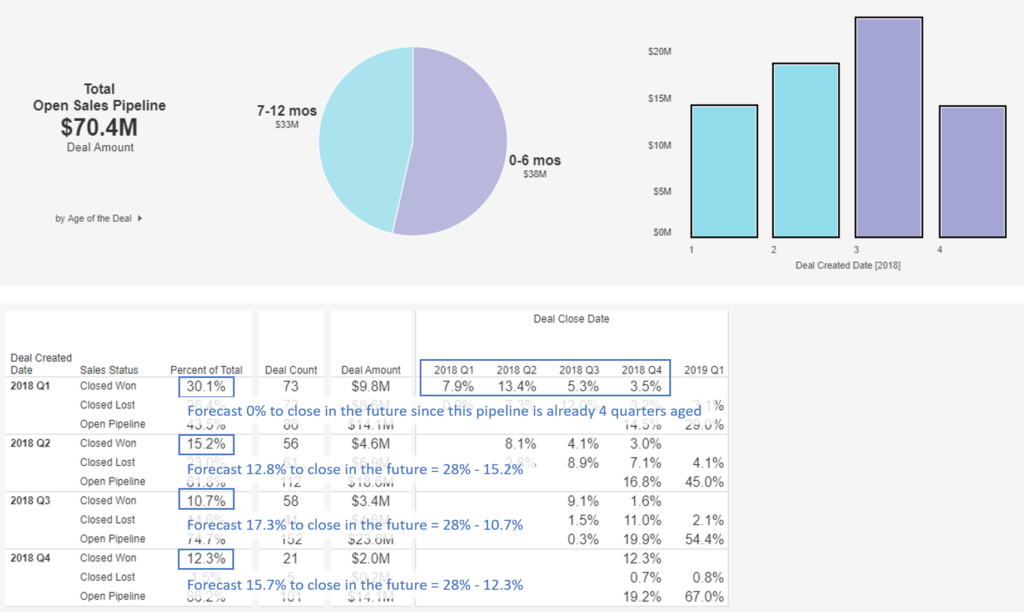
If we assume 28% of pipeline will be Won, then calculate remaining left to win
Next multiply the Original Total Pipeline in those quarters with the expected percentage still yet to close. This results in $11.9 M of Pipeline which is expected to close from deals that are currently in the Pipeline.
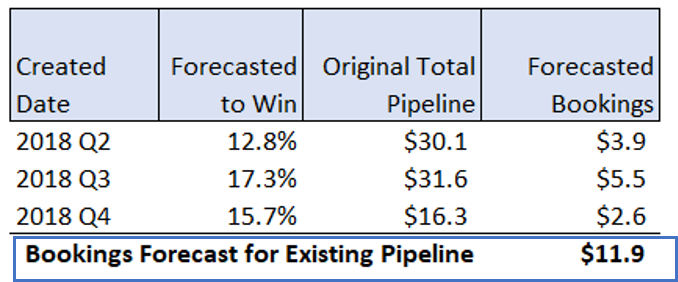
The bookings forecast for existing pipeline calculation
The final step here would be to estimate future Pipeline which will be created throughout the year. The process presented here can then be applied to assume how much of that pipeline will close within the year, and how fast it will close.
Every assumption can be tweaked or customized for a specific deal or a specific scenario. For instance, if we just rolled out a new feature that is a must-have in the marketplace, we may choose to assume a higher close rate. As with all things in forecasting and analysis, the power is in the assumptions.
No forecast is perfect, but with full visibility to historical data, quality pipeline submissions from sales, and some informed decisions along the way you can get close.
For help with improving the new sales bookings forecast at your organization, contact us at info@empowerboc.com and connect with us on Twitter.