WHAT IS TABLEAU PULSE?
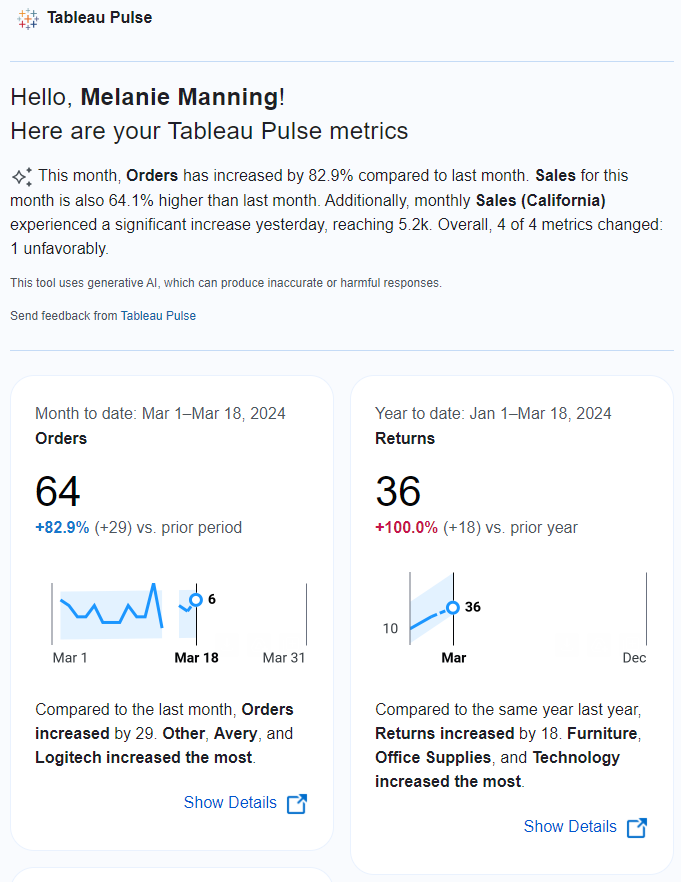
The initial version of Tableau Pulse was released in February 2024 to Cloud users only. Tableau’s release announcement stated it “empowers every employee in your organization with intelligent, personalized, and contextual insights delivered in the flow of work, enabling you to scale insights across the business with unified metrics, and maximizes your data potential with enhanced flexibility to streamline your data analytics journey.”
That’s a mouthful.
As far as I can tell, it combines elements of Tableau’s Metrics and Ask Data features along with Generative AI to deliver automatically formatted insights in natural language. Both the Ask Data and Metrics features were retired in Tableau Cloud in February 2024 and will be retired in Tableau Server with version 2024.2.
HOW IS PULSE DIFFERENT FROM A DASHBOARD?
Pulse connects solely to data sources which have been published to Cloud to generate various analyses and next-level questions. However, all of its functionality is developer configured.
Anyone expecting this first version of Pulse to automatically analyze your data and tell you what’s going on will be disappointed. Developers will have comfort knowing that they retain control over defining metrics and relevant next-level questions in this version. I’ve listed some comparisons between Dashboards and Pulse below.
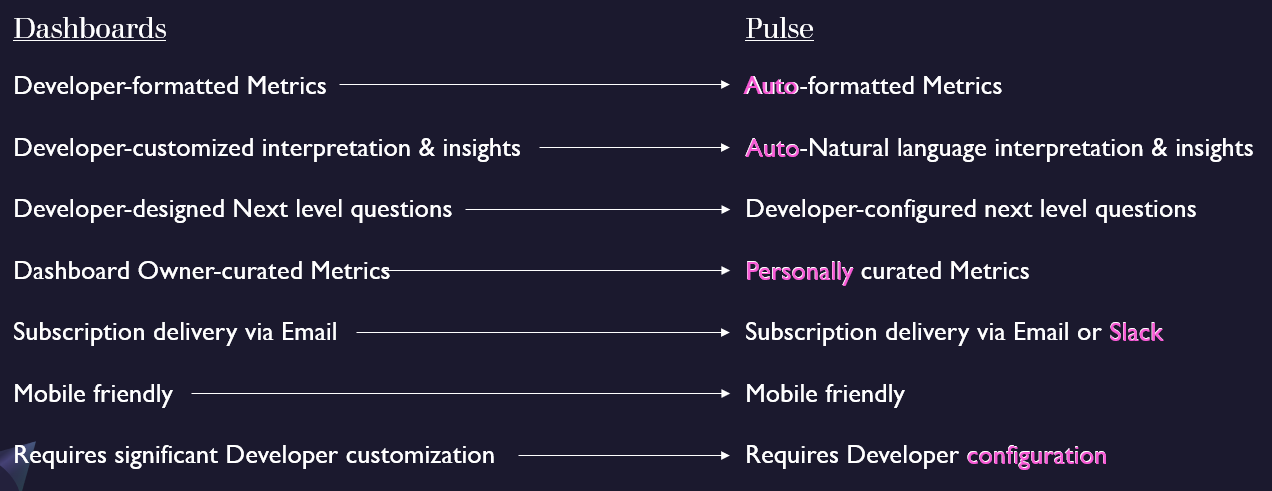
Differences between dashboards and Pulse include increased format automation, which comes with reduced format customization ability, natural language interpretation and insights, and empowerment of the end user to custom select which Metrics they Follow.
At a basic level, 3 elements are required to create a Metric: Measure, Time, and Dimension(s). In her article, 2024: Week 10 Preppin’ for Pulse, Jenny Martin went further to describe data that is an ideal fit for use as a Pulse Metric. She said data must be current, relevant in daily/weekly increments, granular as possible, field names are human readable, and string values consistently named.
It’s worth noting that developers have the ability to control Metric definitions in both dashboards and Pulse. However, because Pulse requires the data source to be published to Cloud, Pulse could result in fewer deviations from standard definitions and thus greater reliability of the reported Metrics.
Removing need for dashboard design can speed a project along. However, the reduced ability to customize the output may not be well received by power users. It remains to be seen whether these differences are net positive for Pulse as compared with dashboards. This gets me thinking about who would benefit from using Pulse.
WHO WOULD BENEFIT FROM USING PULSE OVER A DASHBOARD?
I was initially at a loss to describe the users who would prefer Pulse over a dashboard. As I’ve continued to work with Pulse, and to discuss it with my clients and colleagues, a few key personas come to mind.
“I just want to see this metric”
My good friend Anna Foard identified this user persona as a potential beneficiary of Pulse. They just want visibility as soon as possible. This is a Level 1 ask. Fast delivery for a small scope would be a good fit for Pulse, assuming the data source was already clean and published to Cloud.
The downside for this user would be that the Pulse Metrics live in a different environment from Tableau Cloud. Therefore, they’d be required to jump back and forth if they have dashboards in Cloud that they also use.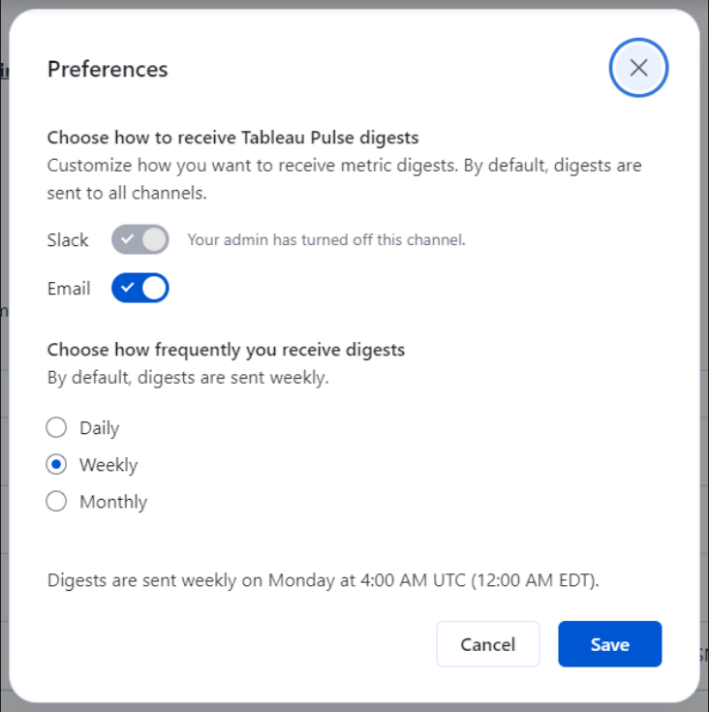
Subscribe to a Metric in Slack
Slack users will appreciate the succinct digest messages which show up under Apps in Slack. Pulse’s initial default is for weekly digest messages but users can update that to be Daily or Monthly.
In the current version, all Metrics which are Followed by a User are included in the Digest. I’d expect to see custom Metric selection for Digests in a future version.
End Users not normally involved in the Dashboard Design Process
Tableau has stated that the target market for Pulse is business users. Oftentimes those users don’t get a say for which Metrics to include in a dashboard. They may find themselves confused by busy dashboards that provide more information than they need to see. Pulse gives them the ability to Follow only those Metrics which are relevant to them.
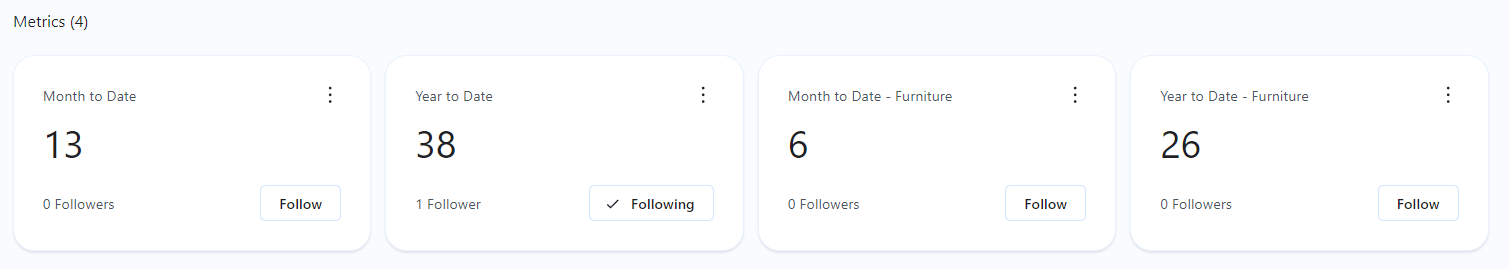
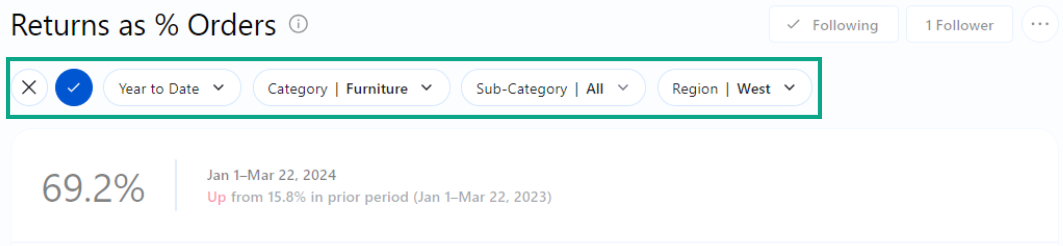
Further, they can filter and then follow a customized version of their Metric for only the Region, Product or other dimension that they are focused on. Anytime a user filters a Metric, it gets saved as an option for other users to choose to Follow.
I see this End User group as being the greatest beneficiaries of Pulse. They get to reduce the noise in their analytics experience while gaining natural language interpretation of Metric results. While a developer creates the data source and configures the initial Metrics, Pulse allows the end user to filter those results to their area of interest and then Follow that specifically filtered Metric.
The ability to create custom filtered metrics is a benefit to these End Users, however the number of custom filtered Metrics could get out of hand if not properly governed. I would expect Tableau to provide governance tools for this purpose in a future version.
Anyone Who Wants to Say They Have an AI Initiative
This may sound cynical but it’s a real thing. In today’s hype of AI, business leaders are being pressured to stay on the cutting edge of innovation. Tableau’s generative AI product certainly fits that mold. It may be version 1.0 today but there is definite potential for positive impact as it evolves.
HOW DO I GET IT?
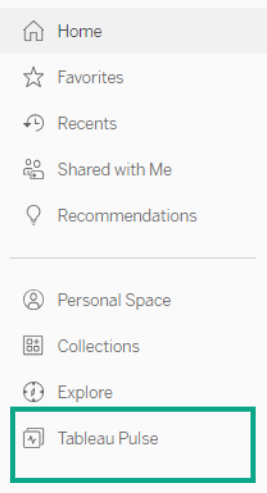
To use Tableau Pulse you must have Tableau Cloud. Pulse has not been released for Tableau Server. If Pulse has been enabled you will see it in the left side menu below ‘Explore.’
If Pulse hasn’t already been enabled for your Cloud site, you must have Admin rights to enable it. Following are some steps to get started.
To enable Tableau Pulse
- In Tableau Cloud, go to Groups
- Add Group named “Pulse Users” – Add yourself to that Group
- In Settings, scroll down to Tableau Pulse Deployment
- Turn on Tableau Pulse
- Only for users in a specific group = “Pulse Users”
- Next scroll to Availability of Tableau AI
- Enable Tableau Pulse Insight Summaries to use generative AI
- Save
You should now see “Tableau Pulse” below “Explore.”
Publish Data to Cloud
If you don’t already have data published to Cloud, you can get started with Sample – Superstore data.
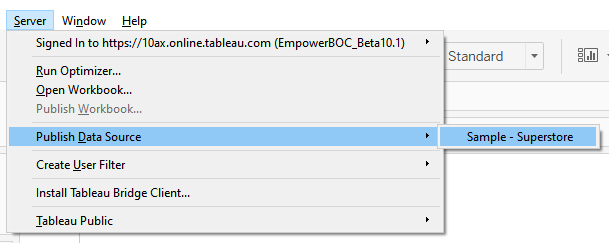
- From Tableau Desktop, connect to the Sample-Superstore saved data source
- Log into your Cloud site from Desktop
- Publish you’re the Sample-Superstore data source to Cloud
Create Your First Metric
- From the Tableau Pulse home page, click ‘New Metric Definition’
- Select Data Source ‘Sample – Superstore’
- On the Definition tab:
- Name: # Orders
- Description: Count of Order Id’s
- Measure: Order ID
- Aggregation: Count
- Show sparkline values to date as: Running Total
- Time dimension: Order Date
- Compared to: Prior Year on top
- Options: Adjustable metric filters: Category, Sub-Category, Region
- Number format: Number, Order, Orders
- On the Insights tab:
- Value going up is: Favorable
- Click ‘Save Definition’
Customize & Follow Your First Metric
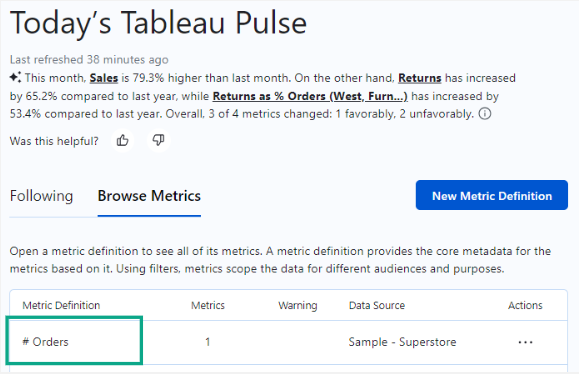
- From the Tableau Pulse home page, click ‘Browse Metrics’
- Click the ‘# Orders’ Metric you just created to view detail
- Click ‘Adjust’ to filter the Metric as you like
- Select the blue check circle to apply your filter selections
You have followed your first Metric! You should begin to receive weekly digest messages via email or Slack, depending on what your site has enabled.
Happy exploring!
Please add Comments if you think of another User Persona who would benefit from using Pulse.
For help with dashboard design and implementation or for help preparing for Pulse & the AI revolution, contact us at info@empowerboc.com.
A helpful resource that I highly recommend is Tableau Tim’s YouTube channel. He has posted a number of helpful videos to help you get comfortable with all the benefits and opportunities of Tableau Pulse.